USDT dominance, or USDT.D, is the share of the total cryptocurrency market capitalisation held in Tether's USDT. Traders watch it because USDT is where money waits when it isn't invested in other coins: when that share rises, investors are usually being cautious; when it falls, money is usually flowing into riskier assets. The gauge below shows the live figure from public market data.
USDT dominance (USDT.D)
LiveRising USDT.D often means money is parking in stablecoins (risk-off); falling USDT.D often means it is moving into other crypto (risk-on). It is a sentiment gauge, not a signal.
How USDT dominance is calculated
The formula is simple:
USDT dominance = USDT market cap ÷ total crypto market cap × 100
USDT's market cap is basically the number of tokens in circulation, because each is worth about one dollar. The total crypto market cap is the sum of the market values of all tracked coins, from bitcoin and ether down to thousands of small tokens.
Because the numerator is stable in price and the denominator swings with bitcoin, most daily movement in USDT.D comes from the rest of the market, not from Tether. A 10% drop in bitcoin, with USDT supply unchanged, pushes dominance up. That is the single most important thing to understand before reading anything into the chart.
The three things that move USDT.D
| Driver | Effect on USDT.D | What it usually means |
|---|---|---|
| Crypto prices fall, USDT supply flat | Rises | Market value is shrinking; USDT's share grows mechanically |
| New USDT issued (people deposit dollars) | Rises | Fresh capital or flight to safety; check whether prices are rising too |
| Crypto prices rise, USDT supply flat | Falls | Risk-on market; other assets outgrow USDT |
| USDT redeemed (supply shrinks) | Falls | Dollars leaving crypto altogether, not necessarily bullish |
So a rising USDT.D can have two very different stories behind it. In a sell-off it's the first row: everything else drops. In a slow accumulation phase it can be the second row: new money arrives in USDT before being deployed. You can tell them apart by checking whether USDT's supply is growing. Our growth chart and the live ticker on the homepage show the supply side.
How traders use the USDT.D chart
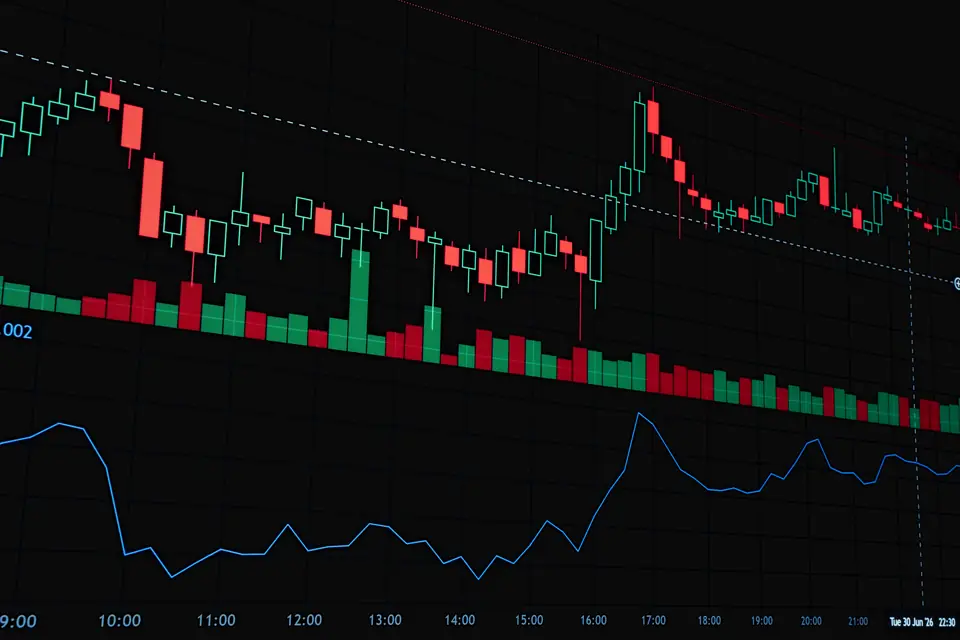
TradingView and similar platforms publish a USDT.D index that traders draw trend lines and support levels on, just like a price chart. Common interpretations include:
- Breakouts upward read as a sign that sellers are in control and money is hiding in stablecoins.
- Breakdowns read as the start of risk-on phases or "altcoin seasons".
- Divergences, where bitcoin makes a new high but USDT.D doesn't make a new low, are read as weakening momentum.
These are interpretations, not laws. Data providers count the total market differently: some include stablecoins, wrapped tokens or memecoins, others don't. That's why the live figure here may not match a chart elsewhere to the decimal.
USDT dominance vs stablecoin dominance
USDT.D only counts Tether. Some analysts prefer total stablecoin dominance (USDT + USDC + others), because money can sit in any dollar token. The two usually move together, but they diverge when one stablecoin gains or loses market share, for example when a regulated exchange delists USDT in a particular region and users switch to USDC.
Stablecoin market share
LiveIf you want the wider picture of how stablecoins compete, see stablecoins explained and USDT vs USDC.
How dominance behaves in different market phases
Looking at past cycles, USDT dominance tends to follow a recognisable pattern, though each cycle has its own twists.
In deep sell-offs, dominance climbs fast. When the Terra/UST collapse and the FTX bankruptcy hit the market in 2022, the value of most crypto assets fell sharply while USDT stayed close to $1, so its share of the shrinking market rose. Interestingly, USDT's own supply also fell that year as holders redeemed billions of dollars, which shows that rising dominance doesn't require money flowing into USDT; it can happen even while money flows out.
In recoveries, dominance usually drifts lower. Prices of bitcoin and other assets rise faster than new USDT is issued, so USDT's slice of the pie shrinks even while its absolute supply grows. The growth from about $66 billion at the end of 2022 to well over $180 billion later shows supply expanding through a bull phase, yet dominance can still fall in such periods because the total market grows faster.
In sideways markets, dominance moves in tight ranges, and traders watch for breaks of those ranges as early hints of direction.
When stablecoin competition shifts, USDT.D can move for reasons unrelated to sentiment at all, for example if large holders switch between USDT and USDC because of regulation in a particular region.
The lesson: always ask why dominance moved, not just where it moved.
Five mistakes people make with USDT.D
- Treating it as a price. USDT.D isn't something you can buy. It's a ratio, and a ratio can rise while every asset involved is falling.
- Ignoring supply changes. Large issuance or redemption shifts the ratio regardless of sentiment. Supply shrank sharply in 2022 and in some recent months; both affected dominance.
- Mixing data sources. A support level drawn on one provider's chart won't line up with another's numbers.
- Using it alone. Without looking at bitcoin, volume and funding rates, USDT.D tells half a story.
- Assuming USDT is risk-free. Rising dominance means money is in USDT, not that it's safe. Read is USDT safe? to understand issuer and freeze risks.
What dominance says about USDT itself
Beyond trading signals, dominance is a reminder of how central USDT has become. With roughly 7% of the entire crypto market and the largest daily trading volume of any coin, USDT is the market's main settlement currency. Most Asian exchanges quote their pairs in USDT, and P2P markets from Manila to Istanbul use it as the bridge between local money and crypto.
That centrality cuts both ways. It makes USDT liquid and easy to use, but it also means a serious problem at Tether would affect the whole market. That's why reserve attestations, redemption behaviour and regulation, all covered in our safety guide, matter even to people who never hold USDT for long.
Want stablecoins on a regulated platform?
If you're moving into USDT during volatile markets, use a verified exchange account and keep your exit route clear before you need it.
Operating since 2013 and registered with FinCEN (US) and the FCA (UK); readers in Asia are served by its international entity. Check availability and local rules in your country.
Turkish readers: USDT dominance in Türkçe
"USDT dominance" is one of the most searched USDT terms in Turkey, where many traders follow it closely. Our Turkish section has a dedicated page with the same live gauge and local context: USDT dominance nedir?.
Methodology and limits
- Data: CoinGecko global market data (
market_cap_percentage.usdtand total market cap in USD), fetched in your browser and cached for five minutes. - Display: the gauge maps 2% to 10% from left to right, a range that has covered USDT.D in recent years. Values outside it pin to the edge.
- Availability: if the data source is down, the gauge hides itself rather than showing stale or invented numbers.
- Not advice: the figure is informational. Read our disclaimer.